This repository was archived by the owner on Jan 10, 2023. It is now read-only.
Home
Welcome to the Intel® Single Event API (Intel® SEAPI) wiki!
Disclaimer: this product does not maintain the release cycle. Build and use on your own risk.
Here is what you can do with Intel® SEAPI:
Memory tracker: http://www.codeproject.com/Tips/1055834/Cross-platform-Visual-Memory-Tracker
Manual and compiler automated instrumentation of your code in different views:
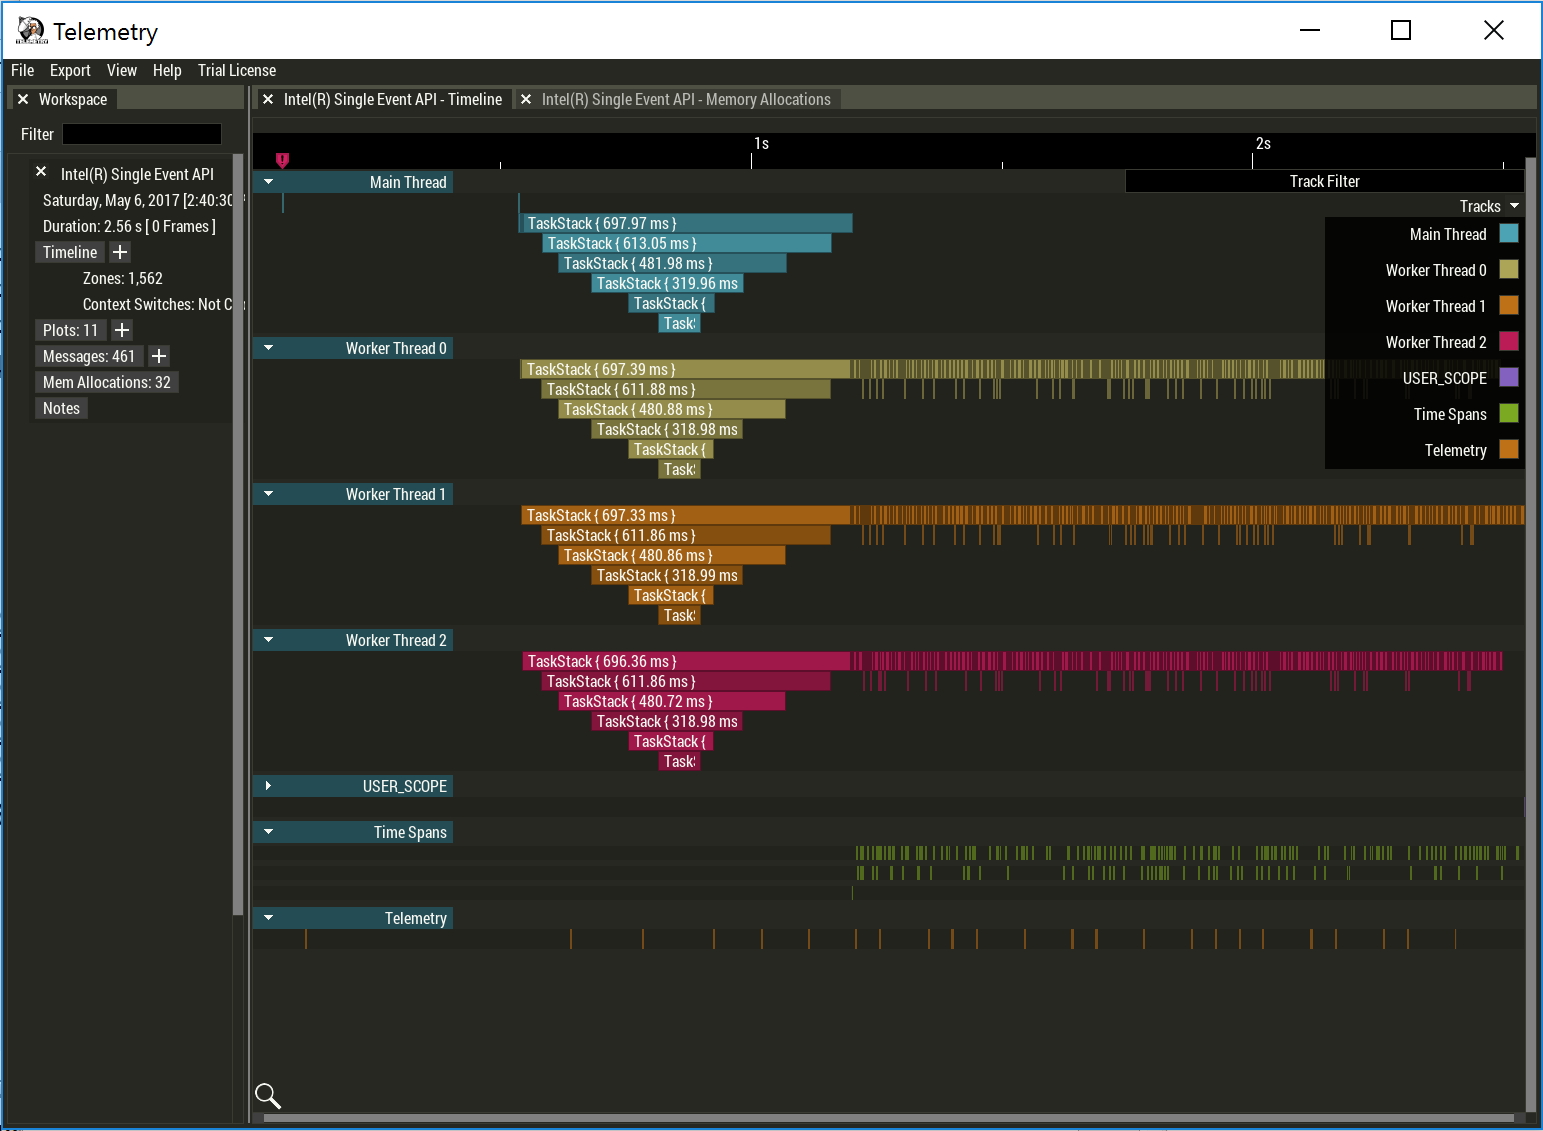
RAD Game Tools' Telemetry: (-f rad)
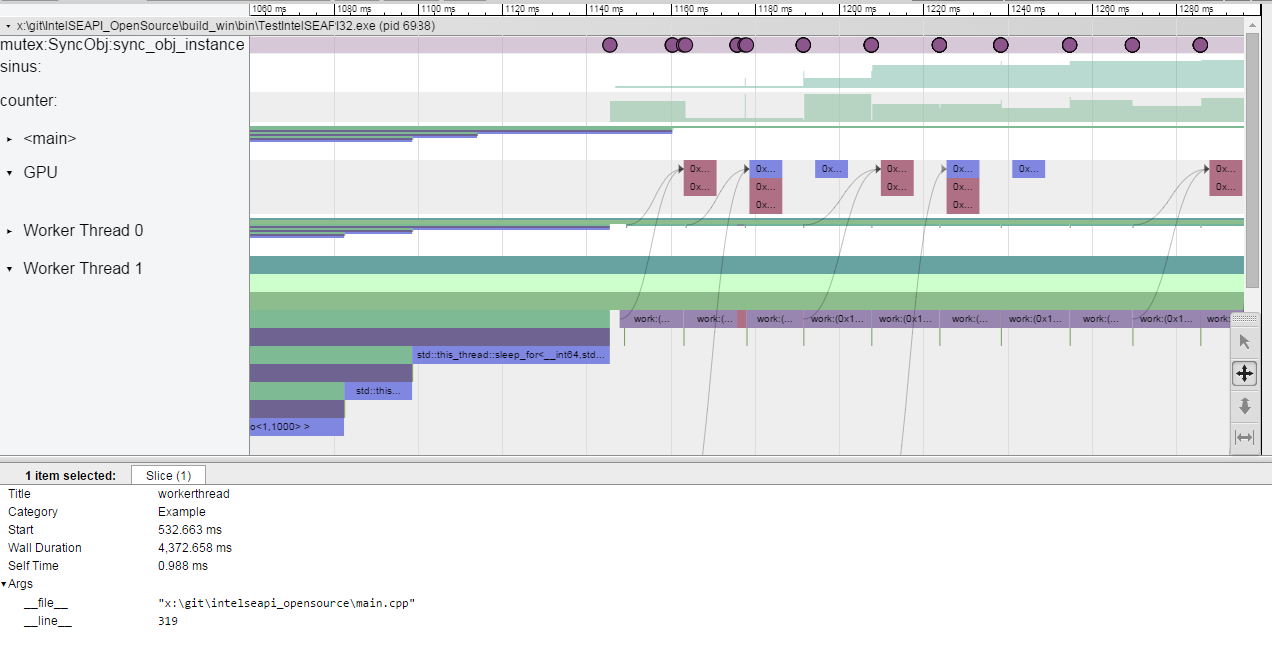
chrome://tracing viewer: (-f gt)
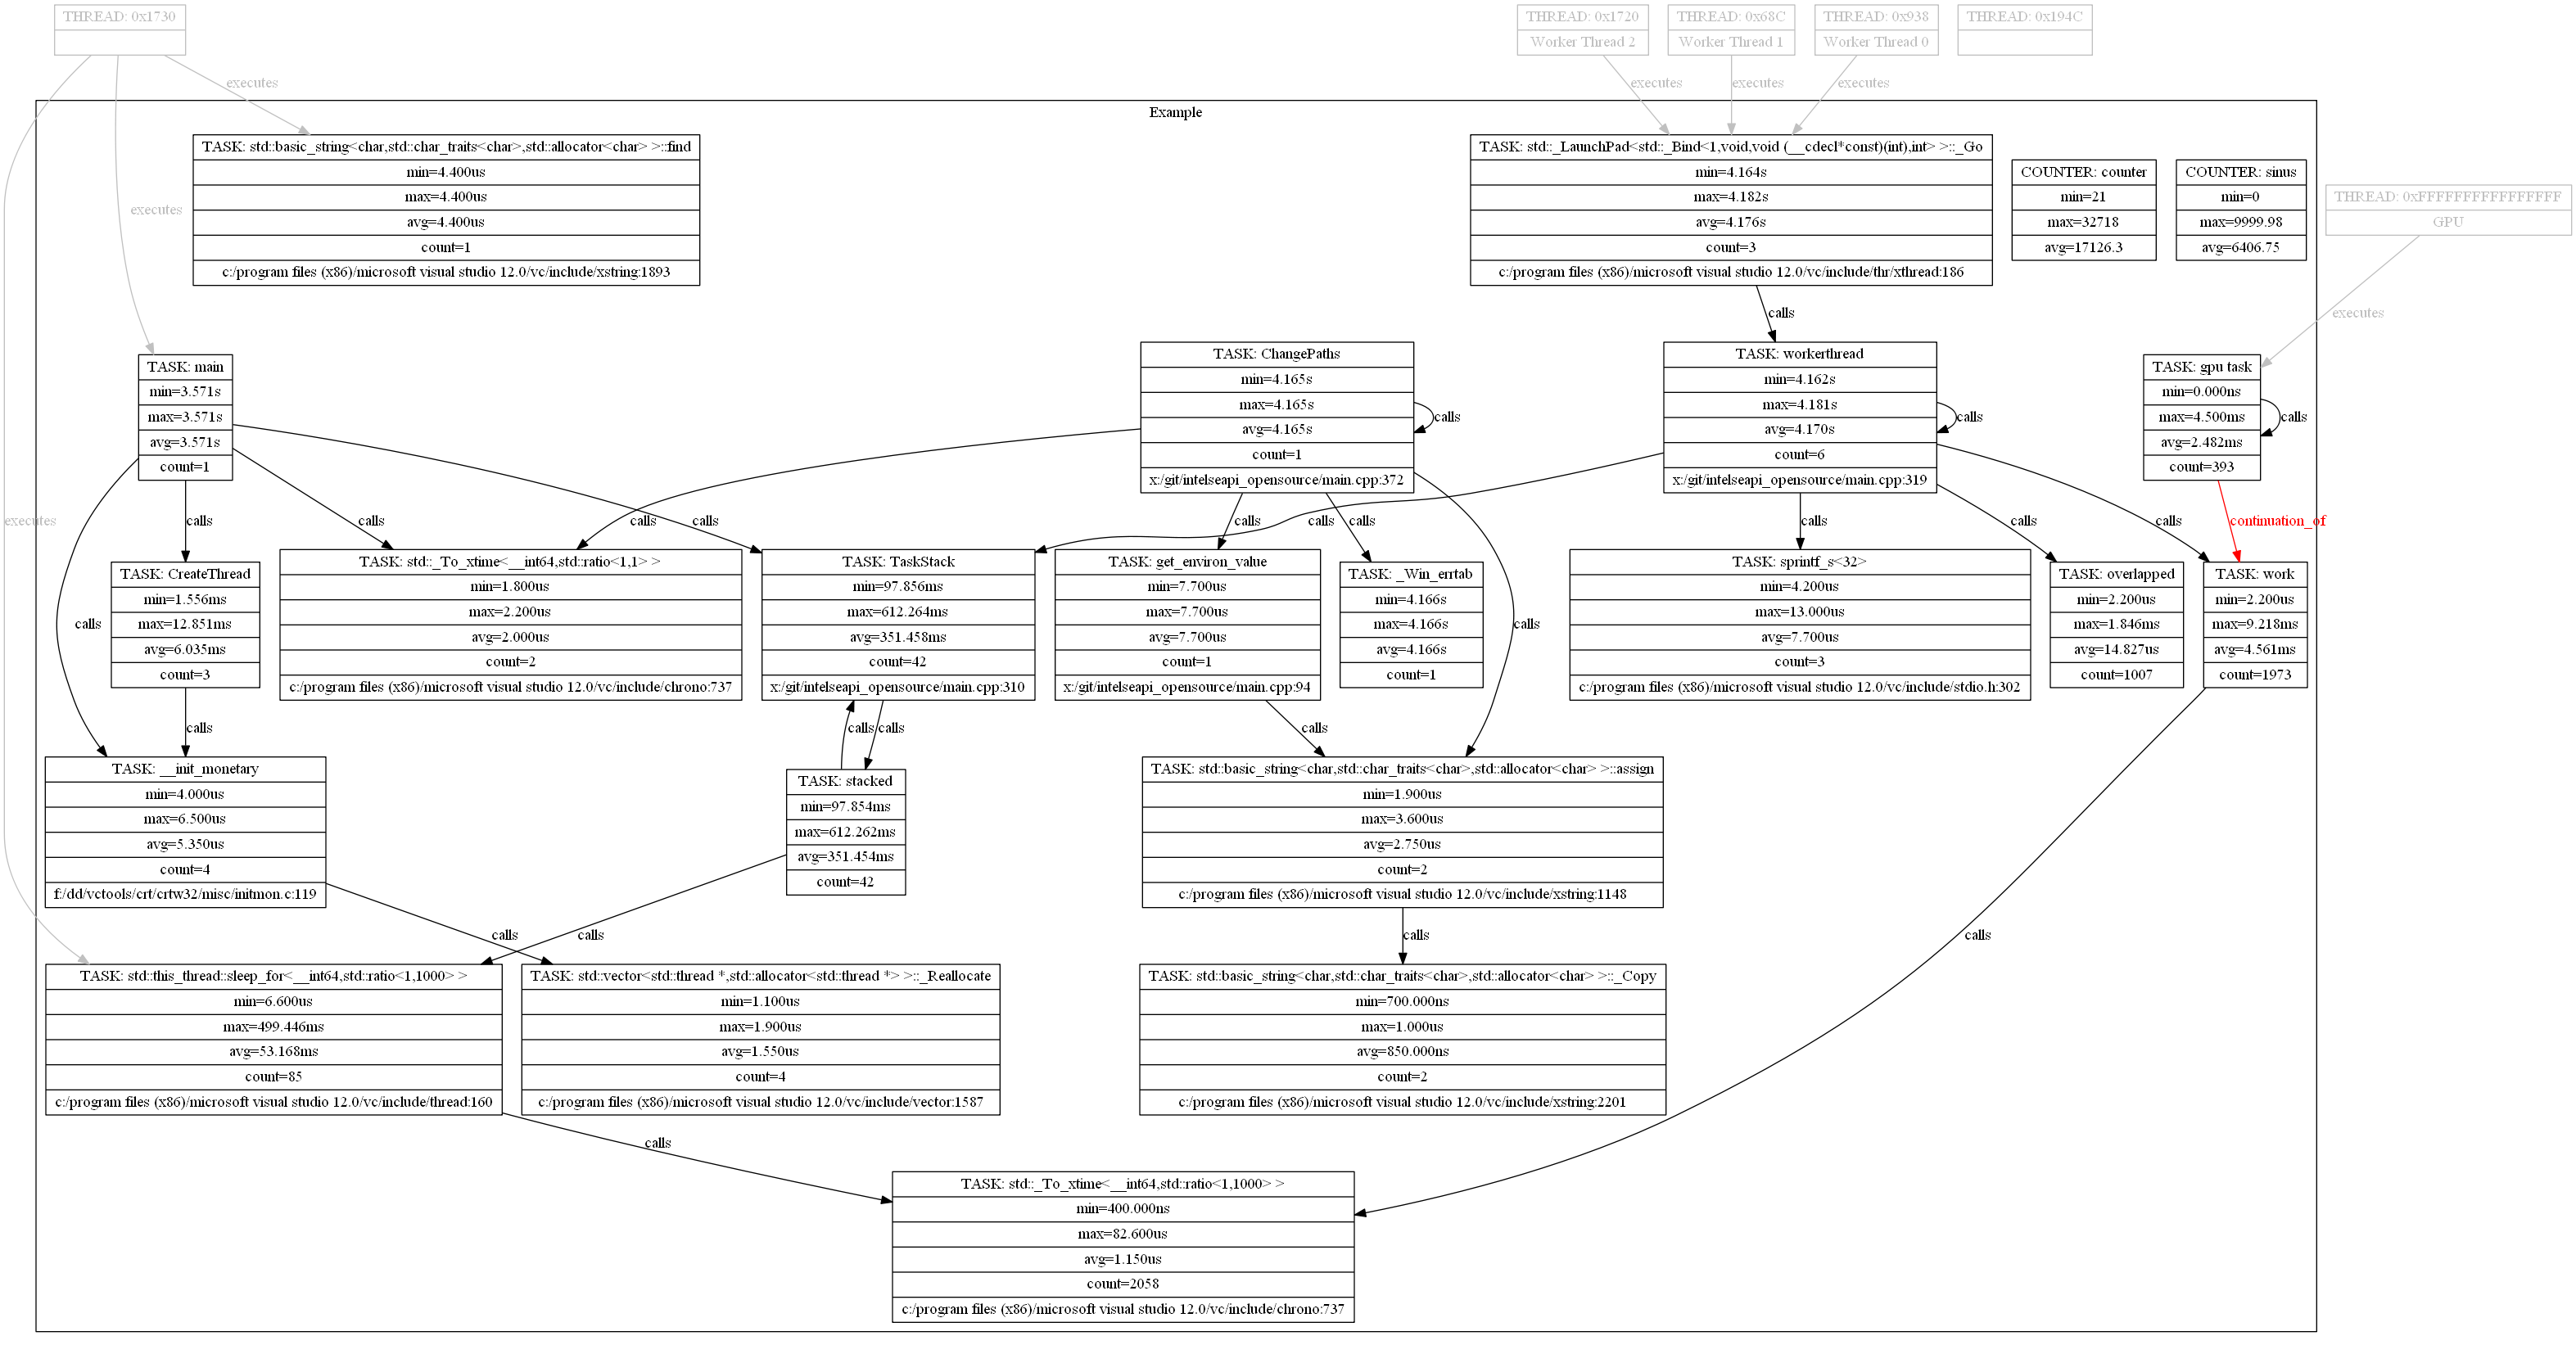
GraphViz: (-f gv)
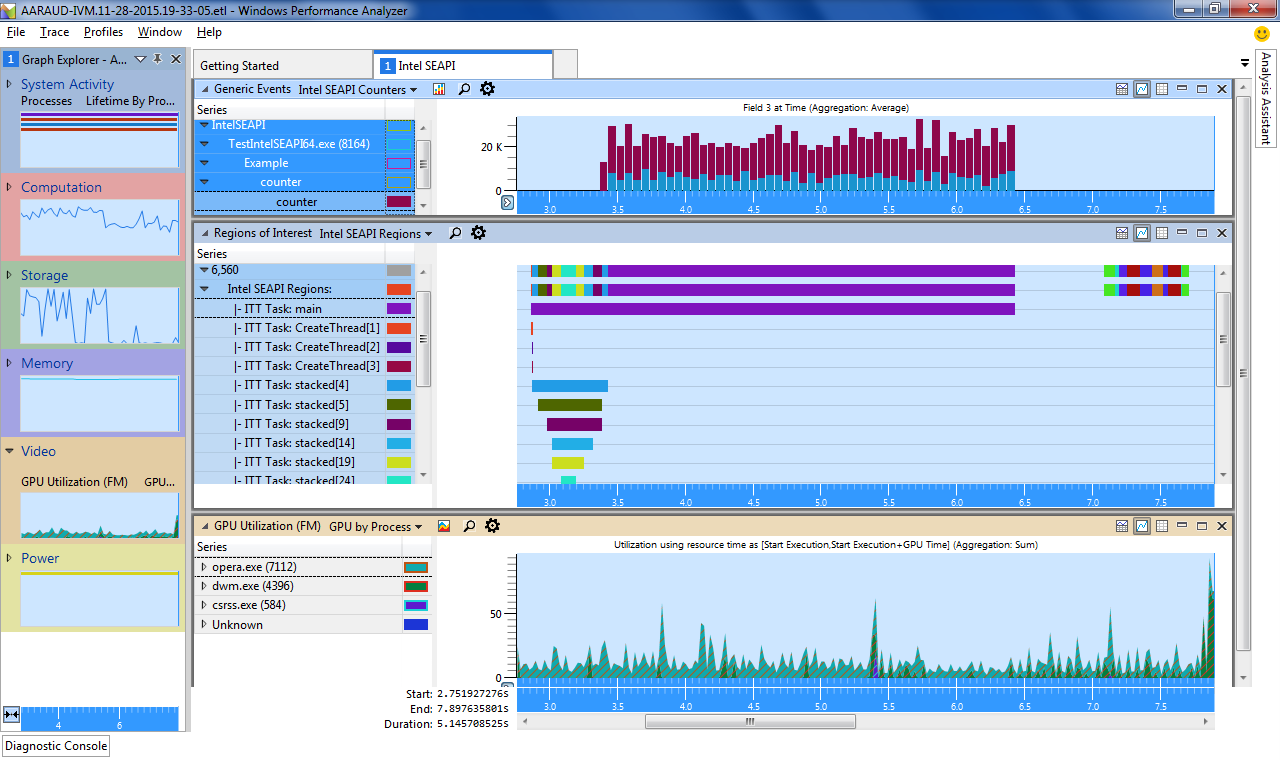
Windows Performance Analyzer: (see readme)
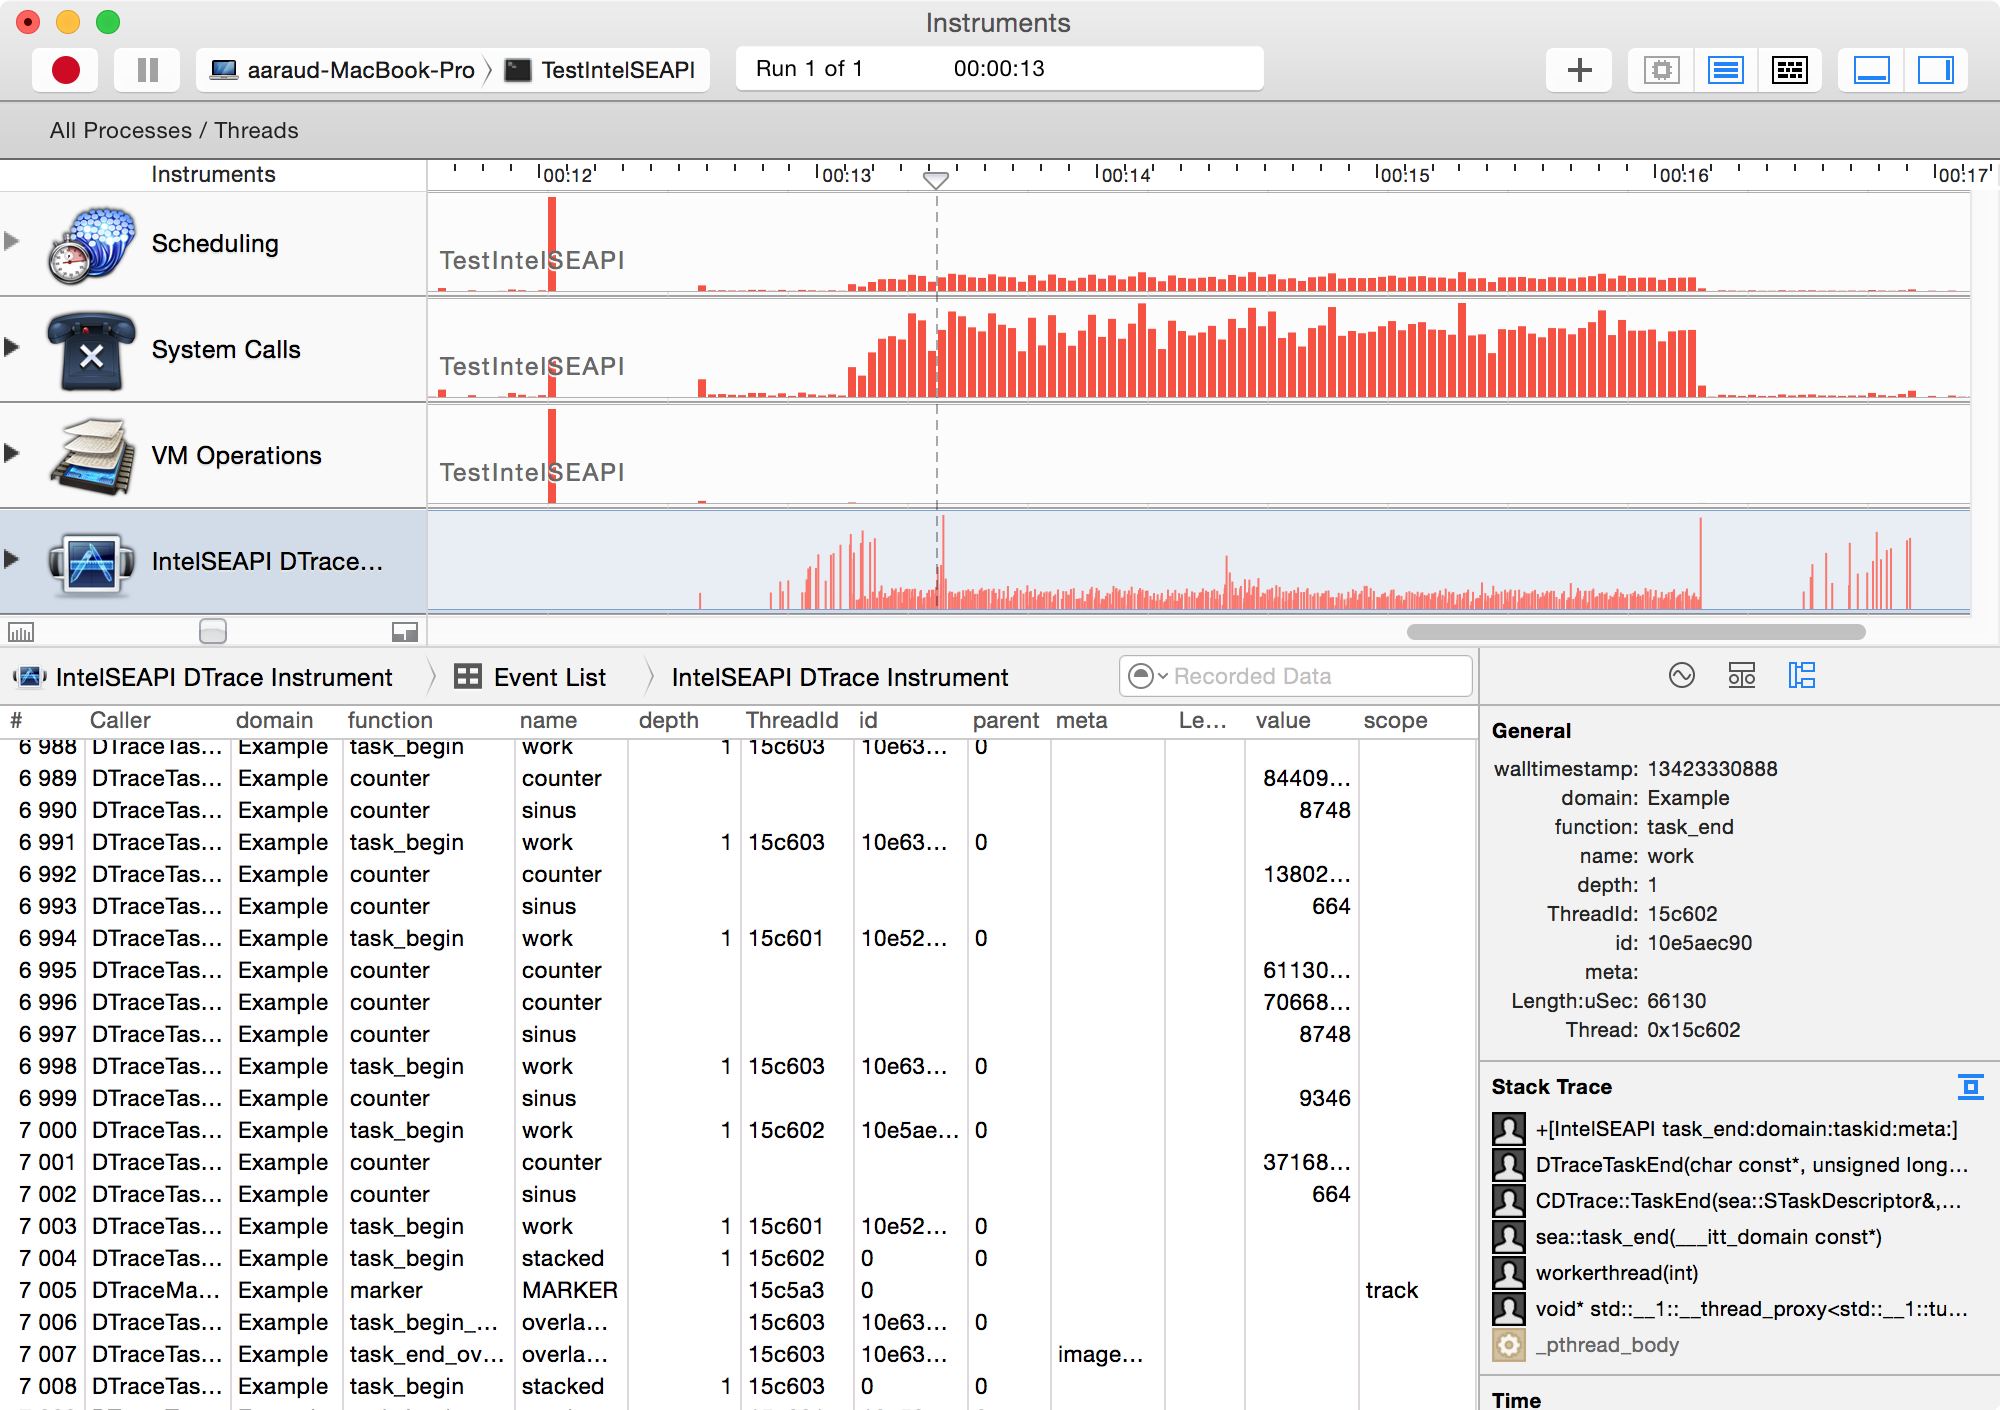
MAC XCode Instruments: (see readme)
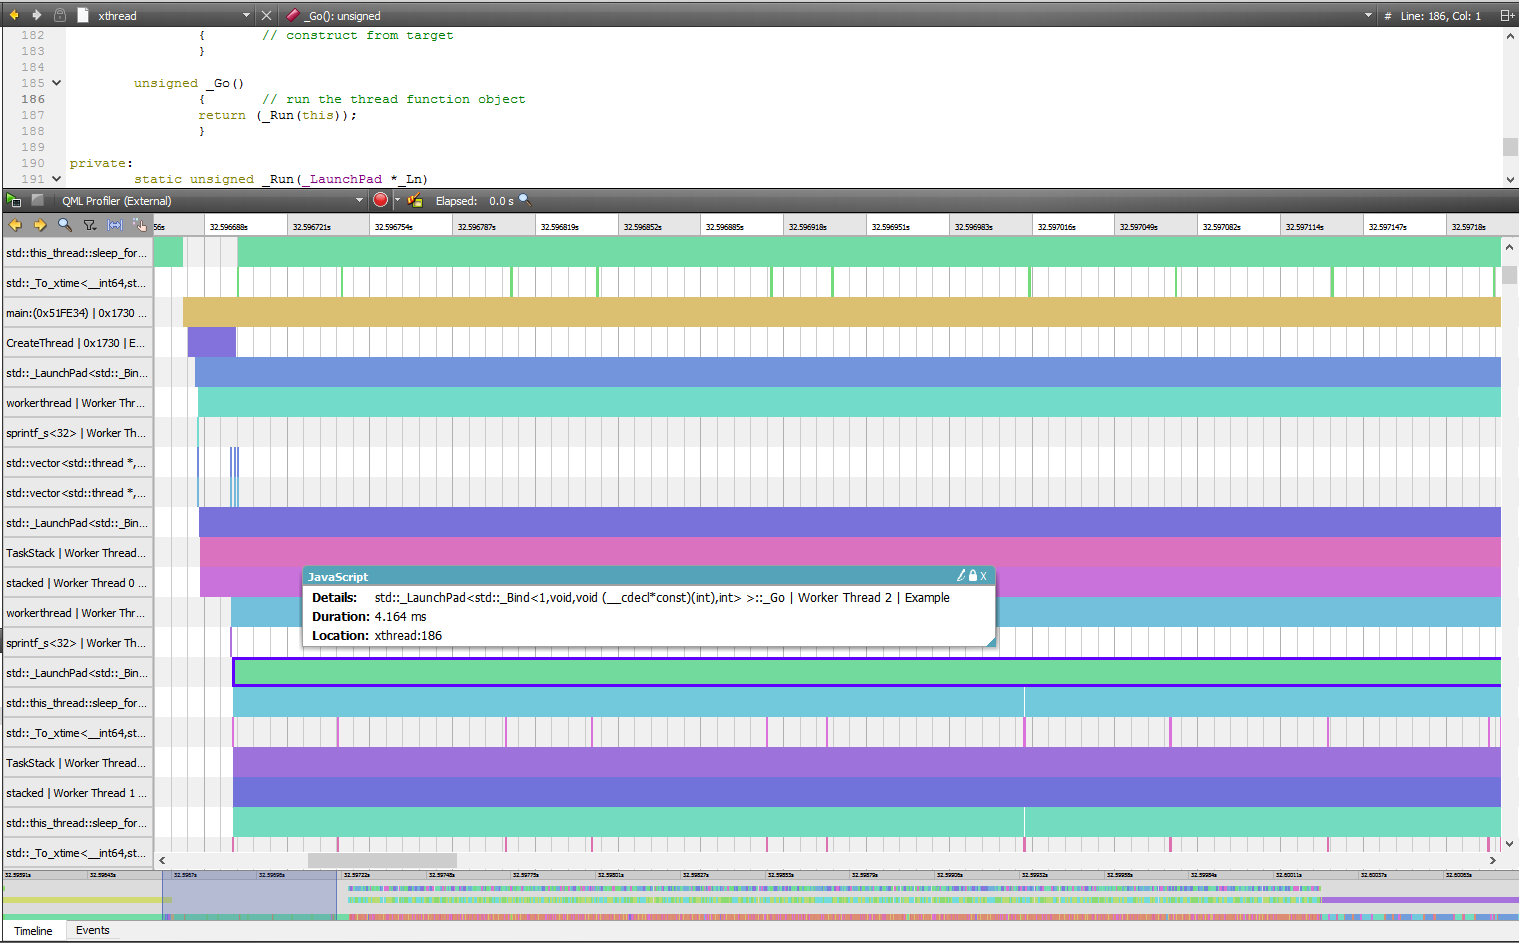
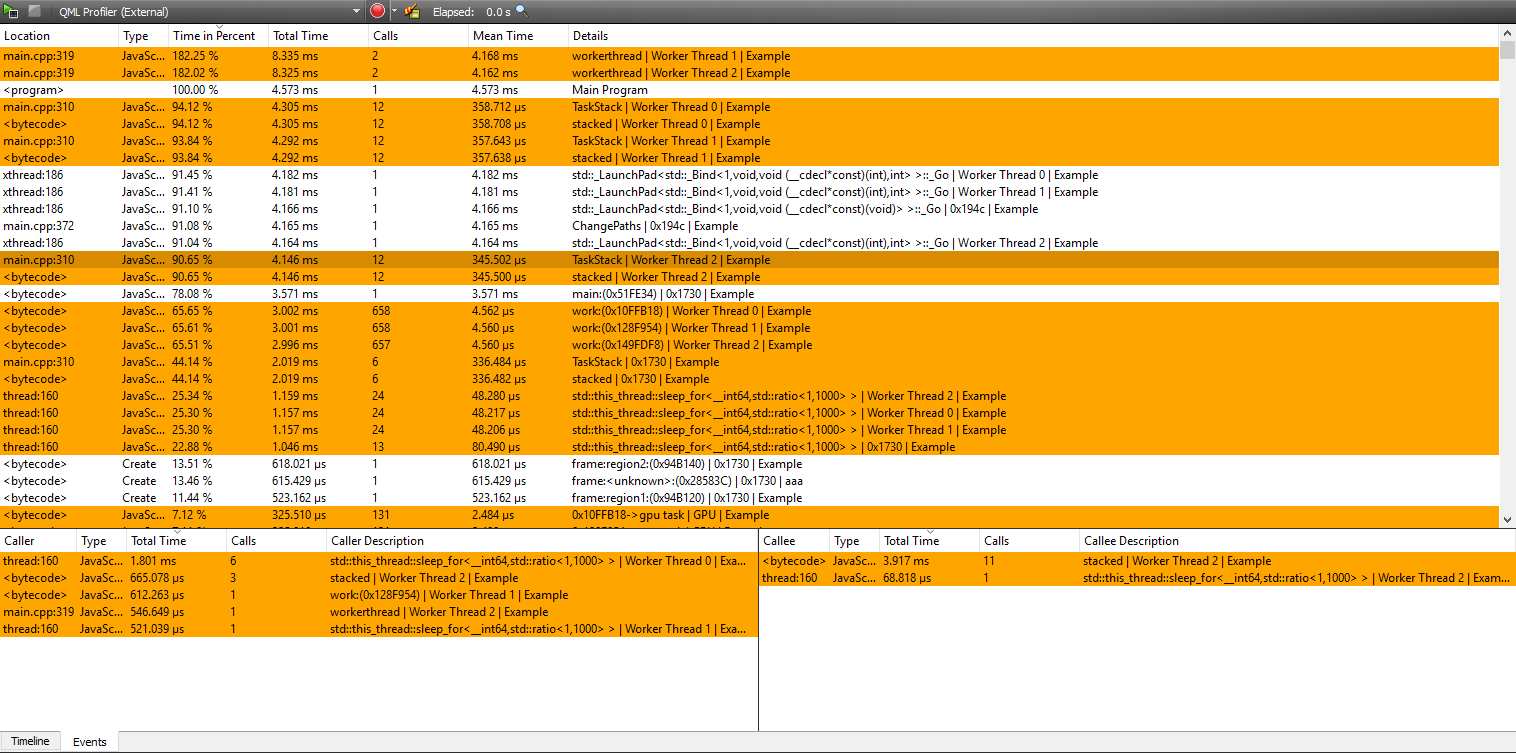
QtCreator Profiler: (-f qt)
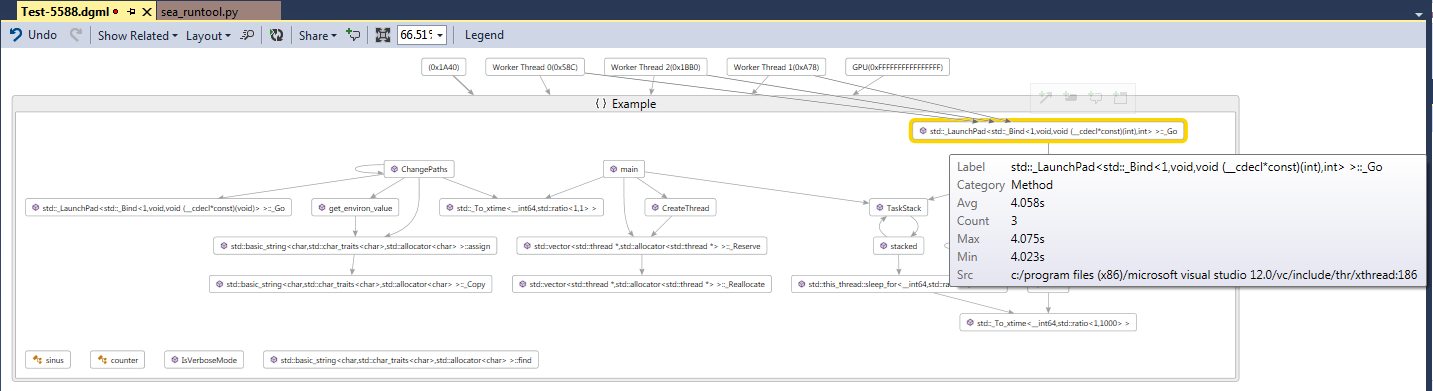
Visual Studio DGML: (-f dgml)
Details on how to get these views for your data are in the Readme.txt
Or you can start with Getting started