
pyextremes
Extreme Value Analysis (EVA) in Python




Documentation: https://georgebv.github.io/pyextremes/
License: MIT
Support: ask a question or create an issue, any input is appreciated and would help develop the project
pyextremes is a Python library aimed at performing univariate Extreme Value Analysis (EVA). It provides tools necessary to perform a wide range of tasks required to perform EVA, such as:
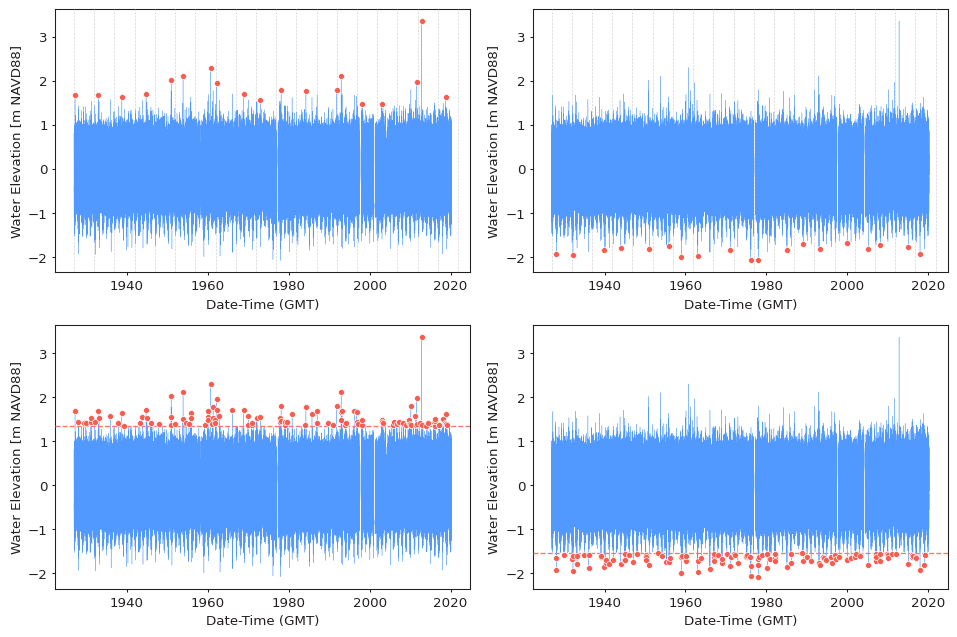
- extraction of extreme events from time series using methods such as Block Maxima (BM) or Peaks Over Threshold (POT)
- fitting continuous distributions, such as GEVD, GPD, or user-specified continuous distributions to the extracted extreme events
- visualization of model inputs, results, and goodness-of-fit statistics
- estimation of extreme events of given probability or return period (e.g. 100-year event) and of corresponding confidence intervals
- tools assisting with model selection and tuning, such as selection of block size in BM and threshold in POT
Multiple ways of fitting distributions to the extreme events are supported:
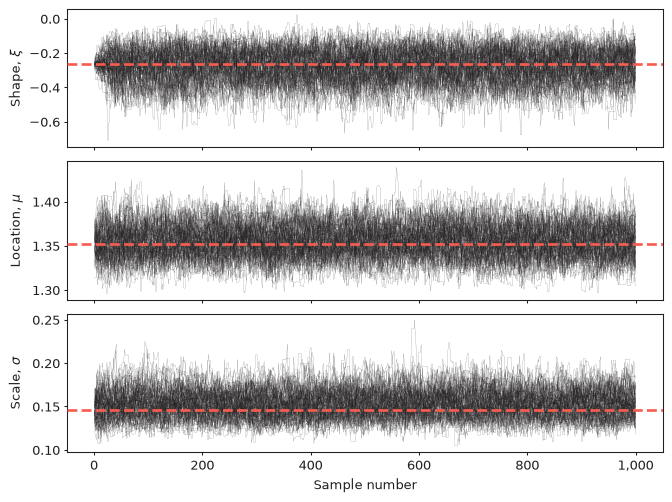
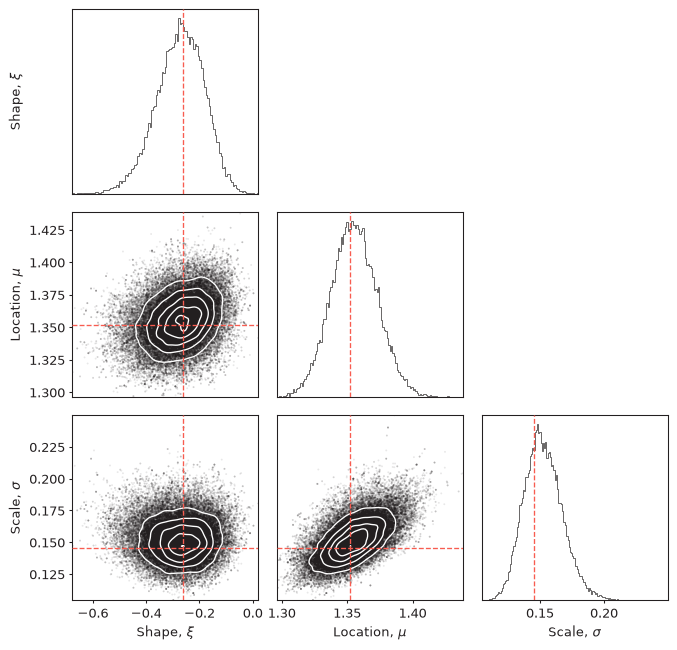
MLE(default) - Maximum Likelihood Estimate, uses SciPyEmcee- Markov Chain Monte Carlo, uses emceeMOM- Method of Moments, uses SciPyLmoments- L-moments, uses lmoments3
pyextremes supports Python 3.9 to 3.14 and works with pandas 1.x, 2.x, and 3.x.
Get latest version from PyPI:
pip install pyextremesOr add it to a project managed by uv:
uv add pyextremesInstall with all optional dependencies (tqdm progress bars and the Lmoments model):
pip install "pyextremes[full]"Get latest experimental build from GitHub:
pip install "pyextremes @ git+https://github.com/georgebv/pyextremes.git"Get pyextremes for the Anaconda Python distribution:
conda install -c conda-forge pyextremesimport pandas as pd
from pyextremes import EVA
data = pd.read_csv("battery_wl.csv", index_col=0, parse_dates=True).squeeze()
model = EVA(data)
model.get_extremes(method="BM", block_size="365.2425D")
model.fit_model()
summary = model.get_summary(
return_period=[1, 2, 5, 10, 25, 50, 100, 250, 500, 1000],
alpha=0.95,
n_samples=1000,
)
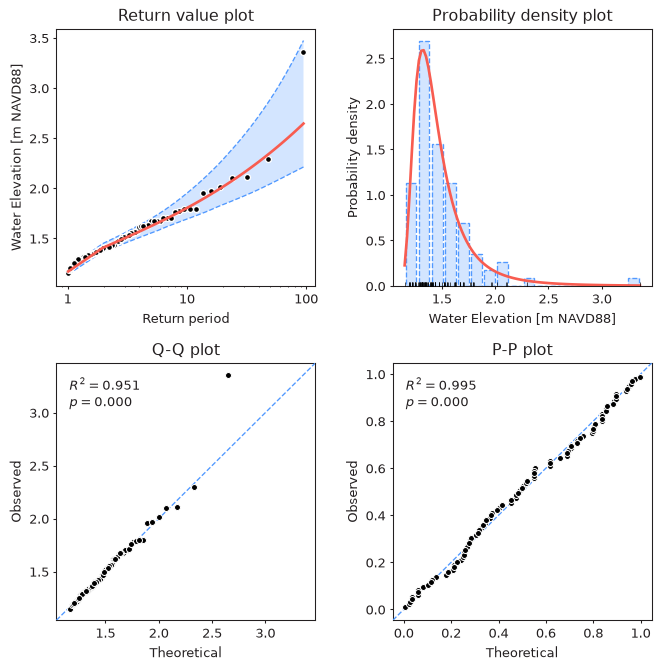
model.plot_diagnostic(alpha=0.95)When running as a script, put this code under if __name__ == "__main__":,
because confidence intervals are calculated in parallel using multiprocessing.
See the Quick Start for the full example (including the data and its preparation) and the User Guide for in-depth tutorials.
Model diagnostic
Extreme value extraction
Trace plot
Corner plot
I wanted to thank Max Larson who has inspired me to start this project and who taught me a lot about extreme value theory.