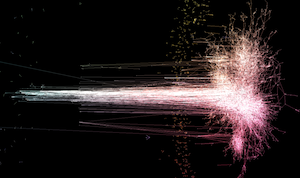
This repository contains visualizations of cause/influence relationships.
It is heavily based on https://github.com/anvaka/pm (though it will likely continue to diverge from that). Please check out that repo for more information and some cool package manager visualizations; I'm building on a fork of that repo because I haven't seen a better tool for web-viewable visualization of the data I want to visualize.
Please read the operating manual - it is short and describes basic navigation principles.
Each graph is indexed individually, and data is pushed to the gh-pages branch
of causalaxies-data.

|
|
I have more datasets I hope to add soon. |
Visualizations in this repository use a slightly-modified version of ngraph.offline.layout that repositions nodes along one axis according to the date/year stored in some node data.
The README in the original repo has a lot of information on local development and experimenting with your own data.
Feedback is welcome! Please create a new issue.